
Using Google Sheets to Collect and Analyze Classroom Data
- Jan 7
- 2 min read
By Shannon Jameson, Carver Elementary
Teachers are constantly gathering information—grades, attendance, reading levels, behavior, assessments, parent communication, and more. Managing all that data can be overwhelming if it’s spread across notebooks, apps, and paper. That’s where Google Sheets becomes a teacher’s best friend.
Sheets isn’t just a digital gradebook. It’s a powerful, flexible tool that can help you collect, organize, and analyze classroom data to make smarter instructional decisions.
Practical Classroom Uses
1. Assessment Tracking
Record quiz/test scores and automatically calculate averages.
Color-code mastery levels (green = mastered, yellow = progressing, red = needs reteach).
Create charts to show individual or class-wide growth over time.

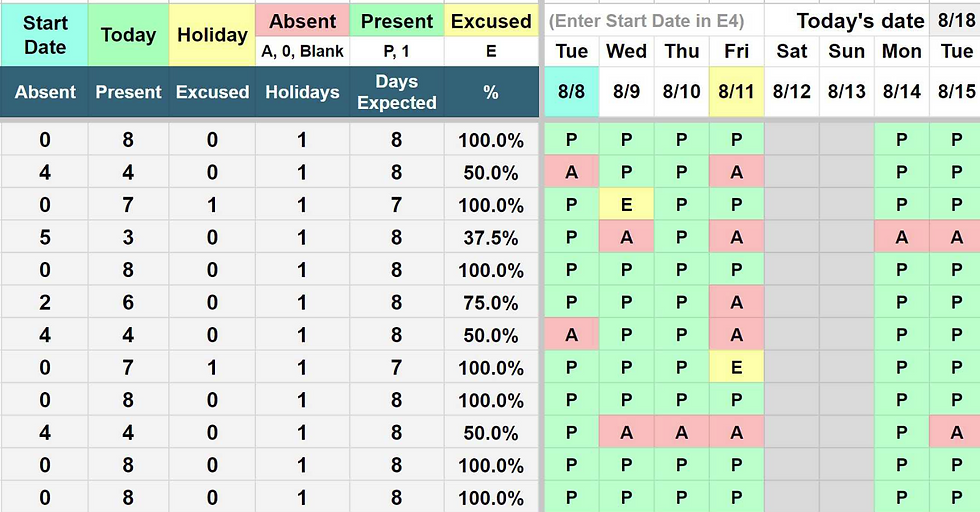
2. Behavior & Attendance Logs
Track daily attendance, tardies, and behavior incidents.
Use filters to spot trends (e.g., Mondays with high absences).
Share with administrators during meetings.

3. Reading & Fluency Data
Record reading levels or fluency words-per-minute each month.
Use line graphs to visualize growth.
Provide feedback to students and parents with easy-to-read visuals.

4. Parent Communication Logs
Keep a simple sheet with columns for date, method (email/phone), and notes.
Helps maintain consistency and documentation for conferences.

Time-Saving Features to Try
Conditional Formatting – Highlight scores below a certain threshold.
Data Validation – Create drop-down menus for consistent entries.
Pivot Tables – Summarize large sets of student data quickly.
Linked Charts – Insert charts into Google Slides for presentations or conferences.
Add-ons & Extensions – Automate grading, attendance, or parent emails.
Final Thoughts
Google Sheets is more than a digital gradebook—it’s a hub for classroom data. With the right setup, teachers can track everything from academics to behavior, then use that information to inform instruction and share progress with students and families.
The best part? Once you create a system that works for your classroom, you can reuse and refine it year after year.